
Link Building Dashboards: What to Track and Which Reporting Tools to Use
 Written by Alistair MacLeod
Most teams call their link building “reporting” something that is actually a pile of scattered link lists. The data lives across three tools, two spreadsheets, and a Slack thread from last month. When a leader asks “did this batch of links actually move rankings?” nobody can answer without an hour of stitching things together. That is the classic “we have data, but we do not have a dashboard” situation.
This guide shows you how to turn your link building metrics into a sustainable, maintainable link building dashboard — what to track, which reporting tools fit different situations, and a copy-paste framework you can start using today.
Why Most Link Building “Reports” Are Not Dashboards
A real Link Building Dashboard answers a question in one glance. Most link building “reports” do not. They are collections — a list of links placed, a screenshot of a backlink tool, a spreadsheet of outreach statuses — that require interpretation before they become useful.
The scattered-data problem: links living across tools and spreadsheets
The core problem is fragmentation. Your outreach status sits in a CRM or a sheet, your placed links live in a backlink tool, your referring domain growth is in another export, and your traffic data is in Search Console and Analytics. To answer “what did we actually gain this month,” you have to open each one, reconcile timestamps, and mentally merge the results. That process is slow, error-prone, and rarely repeated the same way twice.
The consequence is that the data is technically present but practically invisible. Decisions get made on memory and gut feel instead of the numbers, because pulling the numbers together is too much work to do every week.
What this guide delivers: a sustainable dashboard plus a framework
This guide gives you a structured answer. You will learn the difference between a dashboard and a report, the four layers that turn metrics into an actual decision tool, how to choose your data sources, and how to separate agency and client views. At the end, you get a reusable link building dashboard framework and checklist you can adapt to your own workflow, plus links to the deeper guides on metrics, reporting, and ROI.
Link Building Dashboard vs. Report: Know the Difference Before You Build
Before you build anything, clarify what you are building. A dashboard and a report serve different audiences, run on different cadences, and support different decisions. They are complementary, not interchangeable.
Dashboard = near-real-time, glanceable, built for monitoring
A link building dashboard is a monitoring surface. It is designed to be looked at frequently — daily or weekly — by people who need to spot problems and opportunities quickly. It answers operational questions: how many links are in progress, how many placed this week, how many lost, whether any target page dropped. It favors density over narrative: compact tables, status counts, and trend indicators you can scan in seconds.
Report = periodic, narrative, built for review
A report is a periodic narrative. It is built for a review moment — usually monthly — and for stakeholders who want the story behind the numbers. It connects activity to outcomes, explains anomalies, and proposes next steps. Where a dashboard answers “what is happening now,” a report answers “what did this mean, and what should we do about it.” For a full monthly structure, see our detailed guide on link building report best practices.
Audience-first questions: who looks, how often, and what decision follows
The single most useful habit is to design around the audience before touching any tool. Ask who the primary viewer is, how often they look, and what decision they make after looking. An executive checking monthly wants trends and business impact, not a list of individual links. Your SEO team checking daily wants activity, status, and anomalies. If you build without answering these three questions, you risk producing a dashboard that looks polished but drives no decisions — a pretty screenshot.
The Four Layers That Turn Metrics Into a Dashboard
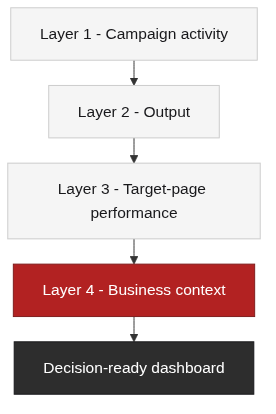
A dashboard is not a flat list of numbers. It is organized so that each layer answers a different question, and together they connect effort to outcome. We recommend four layers, each aligned to the metrics defined in our link building metrics guide.
Layer 1 — Campaign activity: the status flow
This layer shows the pipeline moving from lead to retained link. Track the status flow — lead → pitch → order → content → publish → indexed → retained — with counts for new, in-progress, and completed items each week. This is the operational heartbeat of the campaign. It tells you whether the machine is running, where items are getting stuck, and what the backlog looks like.
Layer 2 — Output: new links, referring domains, and quality
This layer measures what you actually produced. Track new links, new referring domains, lost links, and quality and relevance scoring, plus anchor-text distribution. Because a link only matters once it is indexed, separate placed from indexed from live in your tracking. For the technical side of watching links appear and disappear, our backlink monitoring guide covers that in depth.
Layer 3 — Target-page performance: did the links move anything
This layer connects link actions to outcomes on the pages you targeted. Track ranking, traffic, and indexing changes for those pages over time, tied to the link activity that touched them. This is where you start answering “is this working?” — not just “how many did we place?” Keep it tied to the pages the campaign was designed to support.
Layer 4 — Business context: traffic, rankings, and conversions
This layer gives the dashboard its business meaning. Add referral traffic, conversions, and the overall organic trend so that link activity sits inside the larger picture. We deliberately do not recompute ROI here — that belongs in a dedicated analysis. See our link building ROI guide for the full calculation. Layer 4 is the bridge from “we did a lot” to “this mattered.”
Choosing Data Sources: Manual Spreadsheets vs. Looker Studio vs. SEO Tools
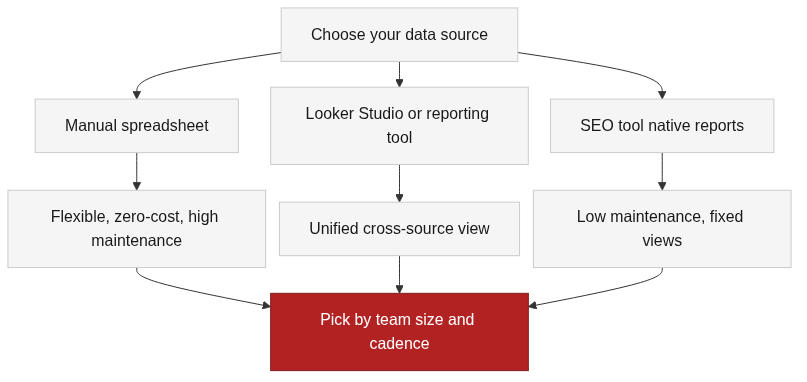
Your data source determines how sustainable the whole dashboard is. There is no single right answer — it depends on team size, how many sources you need to combine, and how much maintenance you can afford. The three common approaches are a manual spreadsheet, an aggregation tool like Looker Studio, and the native reports inside SEO tools.
Manual spreadsheet: flexible and zero-cost, but high maintenance
A spreadsheet gives you maximum flexibility and zero tool cost. You can structure it exactly the way you want and add custom columns for status, quality scoring, and notes. The tradeoff is maintenance: every update is manual, errors creep in, and version control is weak. It works well for a small team or an early-stage campaign, but it becomes a burden as volume and stakeholders grow.
Looker Studio and reporting tools: aggregate multiple sources
When you need one unified view across Search Console, Analytics, and your backlink exports, an aggregation tool becomes valuable. Looker Studio connects to multiple data sources through connectors and lets you arrange fields and charts freely [1]. The maintenance cost is medium — you invest in setting up connectors and keeping them healthy, but the ongoing updates largely run themselves. Because connector ecosystems and free quotas change, treat specific connector capabilities as “per official documentation” and verify them when you set up [1][2].
SEO tool native reports: low maintenance, fixed views
Native reports inside tools like Ahrefs and Semrush are the lowest-maintenance option because the data is already there. They provide backlink growth, referring domains, and lost-link views without any setup [3]. The limitation is that views are fixed to what the tool offers — you cannot easily layer in your own status tracking or business context. These are ideal for quick lookups and single-source monitoring, less ideal for a cross-source dashboard.
A comparison matrix and update cadence advice
| Dimension | Manual Spreadsheet | Looker Studio / Reporting Tool | SEO Tool Native Reports |
|---|---|---|---|
| Data aggregation | Manual paste from multiple sources | Automatic via connectors | Single tool only |
| Customization | Very high | High (drag-and-drop fields/charts) | Low to medium (tool-limited) |
| Real-time feel | Depends on manual updates | Depends on source refresh rate | Tool’s own refresh |
| Maintenance cost | High (error-prone) | Medium (connector setup + upkeep) | Low |
| Best for | Early stage, small team, custom tracking | Unified cross-source view, client reporting | Quick lookups, single source |
On cadence, align your dashboard refreshes with two things: how often each source updates, and the indexing delay between placing a link and it appearing in search. Because new links take time to get indexed and picked up by tools, do not expect today’s placements to show in today’s metrics. A weekly refresh that reconciles placed, indexed, and live is a sensible default for most campaigns.
Separate the Views: Agency and Client Dashboards Are Not the Same
If you manage links for clients, one dashboard cannot serve both your team and the client well. The two audiences need different information at different levels of detail. Keeping them separate is what makes the whole setup sustainable.
Internal execution view: activity, status, and quality anomalies
Your internal view is where the operational detail lives — activity, status, backlog, and quality anomalies. This is the working surface your team checks regularly to keep the pipeline moving. It can be dense because the people looking at it know what every field means and need the granularity.
External client view: output, quality, and business impact
The client view is a cleaner surface. It shows output, quality, business impact, and clear next steps — with the process noise hidden. Clients want to know what was produced, whether it is high quality, how it moved the business, and what happens next. They do not need to see internal outreach notes, failed pitches, or the mechanics of your workflow.
One dataset, two perspectives: staying sustainable without duplicate work
The key to sustainability is a single source of truth with two views, not two separate data sets. Maintain the detailed data once, then build filtered views for each audience. Your internal view shows everything; your client view hides the noise. This avoids the double-entry problem that makes reporting fall apart after a few months. The checklist in the next section includes a specific check for this separation.
Build Your Dashboard: A Step-by-Step Action Guide
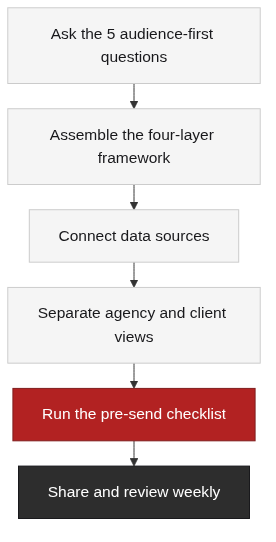
Here is a practical path to get from scattered data to a working dashboard. It follows the audience-first discipline and the four-layer framework above.
Ask the 5 audience-first questions before building
Before you open any tool, answer these five questions:
- 1. Who is the primary user? Executive, team, or client?
- 2. How often do they look? Daily, weekly, or monthly?
- 3. What decision follows the look? Stop, scale, report, or review?
- 4. Where does the data come from, and how often does it refresh? Tool export, connector, or manual entry?
- 5. Who owns maintenance? Is there a clear owner who keeps it fresh and explains anomalies?
Assemble the four-layer framework
Build the dashboard in four layers, in order:
- – Layer 1 — Campaign activity: the lead → pitch → order → content → publish → indexed → retained status flow, with new, in-progress, and completed counts.
- – Layer 2 — Output: new links, new referring domains, lost links, quality and relevance scoring, anchor-text distribution.
- – Layer 3 — Target-page performance: ranking, traffic, and indexing changes on the pages the campaign targeted.
- – Layer 4 — Business context: referral traffic, conversions, and overall organic trend, linked to ROI analysis rather than recomputed here.
Pre-send checklist
Before you share or rely on the dashboard, run through this checklist:
- – [ ] Data sources refreshed to the latest, aligned with indexing delay
- – [ ] Placed vs. indexed vs. live clearly distinguished
- – [ ] Quality and relevance have explicit criteria, not subjective scores
- – [ ] “How much we did” (activity/output) is separate from “whether it worked” (business context)
- – [ ] Agency and client views are separated
- – [ ] A named owner maintains the dashboard and can explain anomalies
- – [ ] ROI calculation links to the dedicated ROI guide instead of being duplicated here
Core Takeaways and Your Next Step
A link building dashboard is a decision tool, not a decorative screenshot. Organize it by layers so each one answers a different question, and design it around the audience so the right people see the right level of detail. Choose data sources that match your maintenance capacity, and keep agency and client views separate to stay sustainable.
The dashboard is a decision tool, not a pretty screenshot
The difference between a useful dashboard and a pretty one is whether it drives decisions. If the executive view shows trends and business impact, the team view shows activity and status, and both connect effort to outcome, you have a tool. If it just displays numbers neatly, you have a screenshot.
Download the reusable Dashboard Framework and Checklist
To start building today, grab the copy-paste link building dashboard framework and checklist on the TraffiClimb blog. It walks you through the five audience-first questions, the four-layer structure, and the pre-send checklist so you can set up a sustainable dashboard without starting from scratch.
Conclusion
Building a link building dashboard is less about picking the fanciest tool and more about organizing your data around the decisions you actually make. Separate dashboards from reports, structure your metrics into four layers, choose data sources you can maintain, and keep internal and client views apart. Start with the audience-first questions, assemble the four-layer framework, and run the pre-send checklist before you share anything. That approach turns scattered link data into a tool your team and your clients can actually use — week after week. A dashboard that nobody opens is just another report, so keep the metrics tied to decisions people make each week and review the setup quarterly. As your link data grows, the four layers and the pre-send checklist keep the dashboard credible without adding busywork.
FAQ
References
Google Looker Studio Help Center — Connect to data sources — documents how Looker Studio connects to data sources such as Google Search Console, Google Analytics, and Google Sheets through connectors, supporting the aggregation claim in the data-source section.
Google Search Console Help — Performance report — explains how queries, clicks, impressions, and average position are measured, supporting the traffic and ranking context used in the target-page and business-context layers.
Ahrefs Help Center — Backlink report — describes the new and lost backlinks, referring domains, and anchor text views used in the output layer and the SEO tool native reports discussion.