
Infographic Link Building: How to Earn Backlinks With Visual Content
 Written by Sanja Gajic

Most SEO teams pour weeks of effort into outreach, pitching article ideas to hundreds of editors and hoping a handful say yes. Meanwhile, a single data-backed, embeddable infographic can do the opposite: it makes editors come to you. That is the core of infographic link building—designing a visual asset that is genuinely worth citing, then making it trivially easy for a publisher to embed it with your brand attribution intact.
This guide walks the full path, from deciding whether an infographic makes sense, to picking a topic and building a credible data foundation, to hosting, outreach, repurposing, and measurement. If you have been treating infographics as “nice-looking images,” you are leaving the link value on the table. The shift is simple: stop making decorative images, and start making citable assets.
Why One Good Infographic Can Out-Earn a Month of Link Outreach
Here is the uncomfortable truth about most link outreach: you are asking an editor to do work. They have to read your pitch, evaluate your article, and decide whether it adds value to their readers. A well-built infographic flips that dynamic. Instead of asking for a favor, you offer a ready-to-use visual that fills an obvious gap in their content.
From Decorative Image to Citable Asset
The mental shift matters more than any single tactic. A decorative infographic is built to look good on your own blog. A citable asset is built to be referenced by someone else. That difference changes every decision downstream: the data you choose, the sources you cite, how you host it, and whether you provide an embed code.
Defining Infographic Link Building
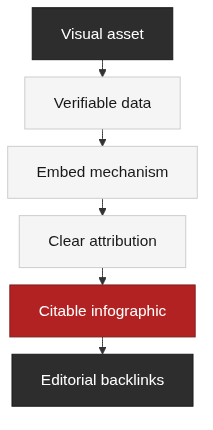
Infographic link building is the strategy of earning editorial backlinks by creating a visual asset that third-party publishers can verify, embed, and attribute. The linkability of that asset rests on three things:
- Verifiable data — every figure can be traced to a primary source and a date.
- An embed mechanism — a publisher can legally drop it into their article with your attribution intact.
- Clear attribution — the brand name and a link back to the original page travel with the graphic.
When those three are in place, editors stop treating your infographic as content to ignore and start treating it as a resource to cite.
What This Guide Covers
We move in the order you would actually execute: whether to build one, what topic and data to use, how to make the asset useful, how to host and promote it, how to keep it fresh, and how to measure whether it was worth the effort. You will also find a checklist to decide whether an infographic is the right vehicle in the first place.
What Is Infographic Link Building and Why Visual Assets Win Links
Visual content earns links for a structural reason: it compresses information into a format editors can slot directly into an article. The brain processes images dramatically faster than text—the widely cited figure is roughly 60,000 times faster, a claim that has been repeated across marketing and cognitive science for years, though it is best treated as a widely cited heuristic rather than a precise measurement [1]. That speed is exactly why publishers reach for a good chart or infographic when they need to explain something quickly.
Decorative Visuals vs. Citable Visual Assets
The difference between a decorative image and a citable asset is not artistry. It is whether an editor can verify it, embed it, and attribute it without risk.
| Dimension | Decorative infographic (rarely earns links) | Citable infographic asset (earns links) |
|---|---|---|
| Data | No source / vague secondhand figures | Verifiable primary source (official statistics, peer-reviewed research, open datasets) |
| Information hierarchy | Stacked icons and decoration | One clear narrative with a logical hierarchy |
| Hosting | Scattered inside a post | A dedicated support page with full context and a citation list |
| Citation mechanism | No embed code | iframe or image + attribution snippet + brand credit |
| Editor decision | Cannot verify, cannot legally cite → reject | Verifiable, embeddable, attributed → cite proactively |
Why Visual Assets Earn Links
Infographics have been a recurring “effective content type” in content marketing benchmarks for years. Content Marketing Institute’s annual B2B content marketing research consistently lists visual assets among the formats marketers rely on to reach their audiences [2]. The reason is practical: a chart or infographic is a self-contained unit of value that a publisher can reuse without rewriting, which is exactly what editors are willing to link to.
When an Infographic Makes Sense (and When It Does Not)
An infographic is the right tool when three things are true:
- You have verifiable data that is genuinely useful to a target publisher’s readers.
- The topic is inherently visual — data comparisons, processes, timelines, rankings.
- You can compress it into one clear narrative with a sensible hierarchy.
When any of those is missing, forcing an infographic wastes effort. If the story lives in nuance and prose, a well-written guide earns links better. If you have no primary data, a decorative graphic will not become citable no matter how polished it looks. Build an infographic only when it is the clearest vehicle for the information.
Choosing the Right Topic and Building a Credible Data Foundation
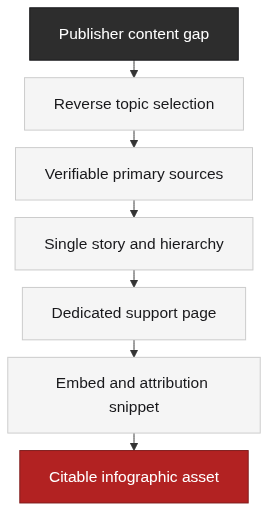
Topic selection in infographic link building is reverse-engineered from the publisher, not from your own product. You are not making a graphic that pleases you; you are making a graphic that fills a gap in content that already exists on relevant sites.
Topic Selection Serves the Publisher’s Readers
Start by studying the publishers you want to earn links from. Look at what they already cover, where their content has gaps, and what visual data they are missing. If a group of industry blogs consistently discusses a trend but never shows the underlying numbers, that gap is your opening. Reverse topic selection means you build the asset that those editors would have wanted, rather than the asset you feel like making.
Data Must Come From Verifiable Primary Sources
The credibility of your infographic lives or dies on its sources. Use primary, verifiable sources: official statistics agencies (for example, national census bureaus or Eurostat), authoritative industry reports, peer-reviewed research, and open datasets [3]. Avoid secondhand blog figures, vague “research shows” claims, and screenshots with no traceable origin. Every figure inside the graphic should carry a source label and a year, and the support page should list the full citation for each one.
Build a Story and Information Hierarchy, Not a Chart Collage
One infographic should tell one story. Decide on a single core narrative, then arrange the data to support it in a clear hierarchy: the headline claim first, supporting evidence next, and context or implications last. Resist the temptation to cram every interesting number you found into one image. A focused narrative is easier to scan, easier to cite, and more likely to be embedded verbatim by an editor.
Making the Asset Useful Rather Than Decorative
Usefulness is what separates an infographic that earns backlinks from one that gets ignored. A useful asset answers a real question, shows its sources, and can be dropped into a third-party article without friction.
Design Brief and Information Hierarchy
Write a design brief before anyone touches the visual. The brief should state the core narrative, the target reader, the key data points in priority order, and the call to action (the brand attribution). Design then serves the narrative rather than decorating it. A clear hierarchy lets a reader grasp the main claim in seconds and dig deeper only if they want to—which is exactly the behavior that makes an editor confident about embedding it.
Host It on a Dedicated Support Page
Do not scatter the infographic as a mid-article image. Publish it on a dedicated support page that provides the full context: the narrative, the methodology, the complete source list, and the embed instructions. A standalone page is easier for a publisher to reference, and it gives you a stable URL to point every outreach message at. This is the foundation of being “legally and conveniently citable.”
Supporting Text, Source Attribution, and Embed / Citation
Provide supporting text that explains the data, not just the visual. Then make citation effortless. Offer an iframe or image embed snippet that includes your brand name and a link back to the original page, and ask publishers to label it “Source: your site” with a link to the page rather than to the image file [4]. If your infographic reuses someone else’s charts or data, get permission or use openly licensed data to avoid a copyright dispute that could force a link removal.
Publishing, Outreach, and Promoting Your Visual Asset
A great infographic is worthless sitting unshared. The promotion phase is where infographic link building turns a well-made asset into a growing list of referring domains.
Finding Publishers Who Actually Embed Visual Assets
Focus your prospecting on editors and blogs that demonstrably cite visual or data assets, not on a generic list of high-DA sites. Look for publishers who have embedded infographics, referenced statistics, or credited other sources in their articles—those are the ones who will recognize your asset as useful. This aligns with the principles of link prospecting: relevance and demonstrated behavior beat raw authority.
Infographic-Specific Outreach
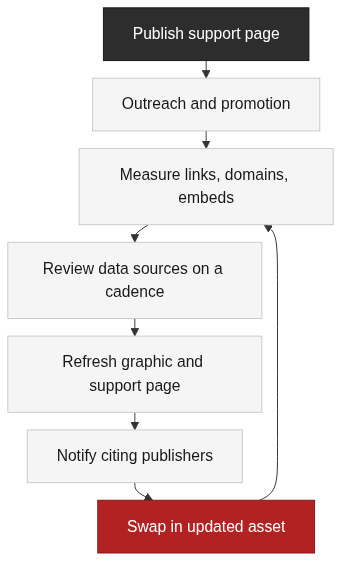
Your outreach angle is different from a standard guest-post pitch. You are not saying “this article is useful to you.” You are saying “this infographic can be embedded directly into your article.” Lead with the asset, provide the ready-made embed code and the attribution line, and make adoption nearly zero-effort. The lower the friction, the higher the acceptance rate. This is the essence of infographic outreach—you are handing an editor a finished resource, not a request, and it follows the same principle of link building outreach: lower the adoption cost and the acceptance rate rises.
Repurposing Your Visual Asset
One infographic can become many assets. Slice it into social cards, turn the data into a SlideShare deck, fold the findings into a report chapter, or extract a single chart for a newsletter. Every repurposed version is another potential entry point for a citation, and it multiplies the reach of the original investment. Repurposing is a unique advantage of visual content over a plain-text post: the same core data can travel in several formats.
Updating, Measuring, and Avoiding Common Failures
Infographic link building does not end at publication. Data goes stale, and stale data gets unlinked. A maintenance plan is what turns a one-off asset into a durable link magnet.
Updating Outdated Infographics
Set a review cadence for every infographic you publish. Recheck each data source and year, refresh the numbers that have moved, and update the support page so the citation list stays accurate. When you refresh a widely embedded graphic, reach out to the publishers who cited it and let them know an updated version is available—many will swap in the new one, which keeps the relationship alive and the link fresh. This is the same principle behind maintaining any linkable asset.
Measuring Results
Track the metrics that tell you whether the asset is working: the number of backlinks it earned, the number of referring domains, the traffic to the support page, and the number of times it was embedded. A single infographic that earns a handful of relevant backlinks is worth more than a large volume of irrelevant links, because relevance and citation intent are what editors and search engines reward.
Common Failures to Avoid
Most infographic link building campaigns fail for predictable reasons. Run this checklist before you send anything:
- Is the data verifiable, or is it a vague secondhand claim?
- Is the design serving the narrative, or is it decoration over substance?
- Is there supporting text and a full source list, or just a floating image?
- Is there an embed and attribution mechanism, or just an image file?
- Are you pitching relevant publishers, or blasting an unrelated DA list?
- Do you have a post-publication update plan, or will the data go stale and get unlinked?
If you cannot check every box, fix it before outreach.
Core Takeaways and Your Next Step
Infographic link building is the practice of turning a decorative image into a citable asset. The difference comes down to verifiable data, an embed mechanism, clear attribution, a dedicated hosting page, and a maintenance plan. A single infographic that is genuinely worth citing will outperform a large pile of low-value links, because it earns the editorial, relevant backlinks that build authority sustainably.
Evaluate Your Visual Asset
Use this six-point self-assessment on any infographic you are considering:
- Data verifiability — can every figure be traced to a source and a date?
- Embeddability — is there an iframe or attribution snippet a publisher can use?
- Attribution clarity — does the brand name and original link travel with the graphic?
- Information value — is it useful, or merely decorative?
- Hosting vehicle — is it on a dedicated support page with full context?
- Update mechanism — is there a plan to keep the data fresh?
Your Next Step
Building a citable infographic is one route to sustainable authority, but it is only one piece of a broader link strategy. If you want to scale your efforts while keeping every placement compliant and content-driven, work with a partner who treats link building as a strategic exercise rather than a volume game. TraffiClimb helps ambitious brands earn premium, relevant backlinks through content-driven strategies that hold up over time.
Before you go, read more on how to structure assets that naturally attract links in our guide to linkable assets, and see why relevant backlinks matter more than raw link count. If you are ready to put a professional link strategy behind your content, talk to the TraffiClimb team about a compliant, results-driven approach.
FAQ
References
3M — Why Visuals Work — provides the widely cited claim that the brain processes visuals dramatically faster than text; treated here as a heuristic rather than a precise measurement
Content Marketing Institute — B2B Content Marketing Benchmarks, Budgets, and Trends — lists visual assets and infographics among the recurring effective content formats in B2B content marketing
Our World in Data — Frequently Asked Questions — explains how open, verifiable primary datasets are presented with source attribution, a model for citable visual assets
Google Search Central — Link best practices — describes how links and attribution should be structured so that a resource is clearly citable and its source is preserved